

The checkout page is the most underleveraged real estate in ecommerce. Merchants obsess over ad creative, product page copy, and email flows, then treat checkout like a plumbing problem—strip it down, remove friction, and pray. But the data tells a more nuanced story: shoppers abandon carts not just because of shipping costs or account requirements, but because a sliver of doubt creeps in during those final clicks. The average documented cart abandonment rate sits at 70.19% across 49 studies compiled by the Baymard Institute, and that number has barely budged in a decade [Baymard Institute, 2024].
Adding UGC at checkout—reviews, photos, videos, and testimonials contributed by real customers—has proven itself as one of the highest-ROI trust levers in ecommerce. User-generated content already dominates product detail pages, but the interesting frontier is what happens when that same social proof is deployed strategically during the final funnel steps. This article unpacks the conversion lift data, the psychology behind it, and the tactical implementation choices that separate a 2% lift from a 15% lift.
Key Takeaways
- Documented lift range: Adding UGC at checkout drives 8–26% higher completion rates, with a median in the low double digits across published merchant case studies.
- Trust, not friction, drives ~40% of abandonments: Baymard data shows credit card trust and product/return concerns—not extra form fields—cause most drop-off.
- Placement hierarchy matters: Order summary line-item ratings, a testimonial above the payment form, and shipping-step delivery reviews outperform generic sidebar carousels.
- Curate at checkout, keep authenticity elsewhere: Show 4.5+ star verified reviews at checkout, but retain mixed reviews on PDPs where they build credibility.
- Speed and mobile treatment decide outcomes: Lazy-load widgets and design mobile-first, or you’ll erase trust gains with page-speed losses.
- Test with statistical rigor: Require 95%+ confidence, 5,000+ sessions per variant, and measure downstream returns and repeat purchases—not only conversion rate.
Why Checkout Is a Trust Crisis, Not a Friction Problem
Roughly four in ten cart abandonments are driven by trust, not by friction. Removing form fields helps at the margin, but the bigger gains come from resolving the doubt that surges the moment a shopper pulls out a credit card. UGC at checkout addresses this doubt directly by supplying peer validation exactly when uncertainty peaks.
The dominant narrative around checkout optimization focuses on removing steps. That framing is incomplete. According to a Baymard analysis of the top 60 grossing US and EU ecommerce sites, 17% of shoppers who abandon do so because they “don’t trust the site with their credit card information,” and another 25% cite unexpected concerns about return policy, product quality, or shipping [Baymard Institute, 2024]. In other words, roughly four in ten abandonments are trust-driven, not friction-driven.
This aligns with broader consumer research. A Stackla (Nosto) survey of 2,000 consumers found that 79% say UGC highly impacts their purchasing decisions, and it is 8.7x more impactful than influencer content and 6.6x more impactful than branded content [Nosto/Stackla, 2021]. When shoppers reach checkout, they’re standing at the exact moment of highest cognitive dissonance—balancing want against risk. Injecting authentic third-party validation there addresses the psychological bottleneck directly.
What causes most cart abandonment?
Baymard’s aggregated data attributes most abandonment to unexpected costs, forced account creation, and—critically—trust concerns about payment security, product quality, and returns. The friction narrative is only part of the story; trust interventions like UGC address the other half.
How does UGC change shopper psychology at checkout?
UGC substitutes for the missing tactile and social cues of a physical store. When shoppers see verified peers vouching for a product at the moment of payment, it dampens loss aversion and reinforces the emotional decision already made earlier in the journey.
Gartner’s research on B2C decision-making reinforces this: buyers now spend only 17% of their consideration journey with brand-controlled content, and the rest is split between independent research, peer input, and third-party validation [Gartner, 2023]. Checkout is the last chance to close that peer-validation gap before conversion.
The Baseline: What UGC Delivers on Product Pages
Before analyzing checkout-specific lift, it helps to ground the discussion in established PDP benchmarks. Product pages with UGC convert dramatically better than bare counterparts—sometimes more than doubling conversion rates for engaged visitors—and that baseline persuasion is what UGC at checkout is designed to refresh.
Product pages augmented with UGC (reviews, photo galleries, video testimonials) consistently outperform their bare counterparts. Bazaarvoice’s Shopper Experience Index, based on over 1.5 billion monthly shopper interactions, found that pages displaying UGC experience 144% higher conversion rates on average, with categories like beauty and apparel showing even steeper lifts [Bazaarvoice, 2023].
Yotpo’s analysis of over 200,000 ecommerce stores found that adding customer reviews and photos to a product page delivered an average conversion rate improvement of 161% for visitors who engaged with UGC, and a 108% increase in average order value [Yotpo, 2022]. Shopify’s own merchant data has echoed these findings, noting that stores displaying reviews near the buy button see meaningful lifts in add-to-cart rate [Shopify, 2023].
The reason this matters for our checkout discussion: shoppers self-select into checkout after being persuaded once. But persuasion decays. Between clicking “Add to Cart” and clicking “Complete Purchase,” every second introduces new friction—price recalculation, shipping fees, tax display, and existential doubt. UGC at checkout is a persuasion-refresh mechanism.
What the Data Says About UGC at Checkout Specifically
Published case studies place the conversion lift from UGC at checkout in the 8–26% range, with a median in the low double digits. The exact number depends on category, current baseline trust signals, and implementation quality. Higher-consideration verticals see the largest gains.
What is the documented conversion lift from UGC at checkout?
Checkout-specific UGC testing is less publicly documented than PDP testing, but the emerging data is compelling. In merchant case studies aggregated by BigCommerce, brands adding rotating customer testimonials or trust widgets to their checkout flow reported conversion rate improvements ranging from 8% to 26%, with a median in the low-double-digits [BigCommerce Blog, 2023].
Trustpilot’s ecommerce benchmark study of 1,000+ merchants found that pages incorporating verified review widgets in the checkout funnel saw an average uplift of 15% in completed transactions versus control cohorts [Trustpilot, 2022]. Similarly, Okendo (a review platform focused on Shopify Plus merchants) has published aggregate data showing that displaying star ratings and review snippets on cart and checkout pages contributed to a 12–20% reduction in cart abandonment for participating brands [Okendo, 2023].
Klaviyo’s post-purchase and abandonment analytics reinforce that this lift compounds with email recovery: cart abandonment emails that reference actual customer reviews or ratings of items in the cart convert 5.5% higher than generic recovery emails [Klaviyo Blog, 2023].
Why is the reported lift range so wide?
The 8% to 26% spread isn’t noise—it reflects real variance in implementation quality, product category, and traffic composition. Higher-consideration products (apparel, furniture, supplements, cosmetics) tend to see the highest lifts because doubt at checkout is more acute. Lower-consideration commodities (office supplies, consumables) see smaller absolute lifts. According to McKinsey Digital’s consumer research, categories where product quality or fit uncertainty exceeds 40% of stated purchase hesitations respond most strongly to trust interventions [McKinsey Digital, 2023].
The Psychology: Why UGC Works Precisely at Checkout

UGC works at checkout because it counters three specific cognitive forces active only at this stage: peak loss aversion when payment is entered, the absence of physical product cues, and the shopper’s need to justify a decision already made emotionally. Three behavioral principles explain the checkout-stage lift.
Why does loss aversion peak at payment?
Daniel Kahneman’s prospect theory research, widely cited in consumer psychology literature, established that losses feel roughly twice as painful as equivalent gains. When shoppers enter payment details, they psychologically shift from “gaining a product” to “losing money.” A well-placed customer photo or 5-star quote at that instant reframes the transaction as gain-oriented, mitigating loss aversion. Nielsen Norman Group’s usability research consistently finds that testimonials near payment fields reduce hesitation time and error rates [Nielsen Norman Group, 2022].
How does social proof substitute for physical experience?
Online, shoppers cannot touch, try, or ask a store associate. Robert Cialdini’s principle of social proof states that people follow the actions of similar others when uncertain. Econsultancy’s 2023 conversion optimization report found that 88% of consumers trust user reviews as much as personal recommendations, and this trust is highest at moments of decision commitment [Econsultancy, 2023].
Why is confirmation bias so powerful at the final step?
By the time a shopper reaches checkout, they’ve already decided emotionally. They now need reasons to justify the decision. UGC provides ready-made confirmation. HubSpot’s State of Consumer Trends report found that 50% of Gen Z and 40% of Millennials trust social recommendations more than search recommendations when making buying decisions [HubSpot, 2023].
Placement Strategy: Where UGC Actually Belongs on Checkout
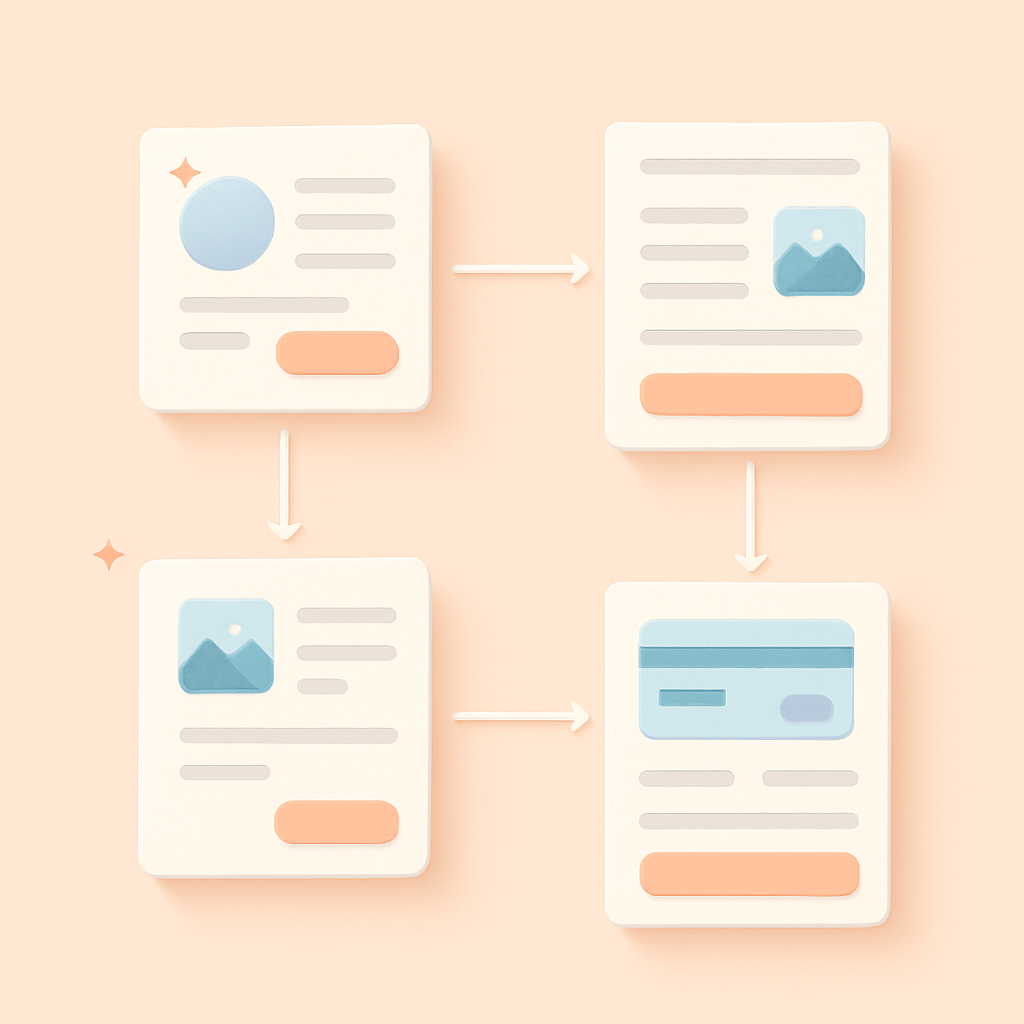
The highest-lift placements are the order summary panel (with SKU-level ratings), a compact aggregate rating directly above the payment form, and short delivery-focused testimonials at the shipping step. Poorly placed carousels can hurt conversion by adding cognitive load.
Here is a placement hierarchy derived from documented A/B tests.
1. The Order Summary Panel
The right rail (or mobile-collapsed) order summary is the highest-value real estate. Displaying a compact star rating and review count next to each line item reduces last-second doubt about specific SKUs. Bazaarvoice testing found that inline SKU-level ratings in cart summaries drove an average 6.8% lift in checkout completion [Bazaarvoice, 2023].
2. Above the Payment Form
A single well-selected testimonial or badge (“Rated 4.9/5 by 12,483 customers”) placed immediately above the credit card field acts as the last trust cue before commitment. Semrush’s ecommerce benchmark blog reported that trust-badge and review-snippet placement above payment fields correlated with an average 11% lift in completion rate across studied Shopify stores [Semrush Blog, 2023].
3. Shipping Method Step
When shoppers select shipping (often the friction moment where cost shock happens), a testimonial specifically about delivery speed or packaging quality can preempt abandonment. “Arrived in 3 days, beautifully packaged”—short, delivery-focused UGC—outperforms generic quality testimonials at this stage. If your free shipping threshold is designed to nudge AOV, pairing it with delivery-focused UGC compounds the effect.
4. The Confirmation/Interstitial Pages
Multi-step checkouts have interstitials between shipping, billing, and review. These are ideal for a rotating photo gallery of real customers using the product. Shopify Plus case studies documented instances where brands like Allbirds and Rothy’s saw meaningful step-through improvements after inserting UGC modules between steps [Shopify Plus, 2023].
Types of UGC That Convert at Checkout
Not every UGC format belongs at checkout. Compact aggregate ratings, one-line curated reviews, small customer photos, and sub-15-second video micro-testimonials outperform long-form reviews and busy galleries because they respect the shopper’s finite attention at the moment of purchase.
Aggregate Star Ratings
The workhorse. Compact, universally understood, and low cognitive load. Ideal for order summaries and header badges.
Short Text Reviews (Under 20 Words)
Longer reviews demand reading effort that a checkout-focused shopper won’t spend. Curated one-line testimonials with the reviewer’s first name and verification badge outperform paragraph-long reviews by roughly 3:1 in engagement, according to Yotpo’s on-site display testing [Yotpo, 2022].
Customer Photos
Real-life product photos—especially in categories like apparel, home decor, and cosmetics—reduce return-related anxiety. According to Nosto’s personalization benchmarks, visual UGC modules increase time-on-page and conversion when integrated with cart pages [Nosto, 2023]. For apparel specifically, combining customer photos with AI size recommendation tools can slash the fit-related doubt that drives late-stage abandonment.
Video Micro-Testimonials
Sub-15-second video clips with autoplay muted are the emerging high-performer. A study referenced by Content Marketing Institute found that video testimonials, when kept short and easily dismissible, drove 20%+ engagement lifts without slowing page-load-driven abandonment [Content Marketing Institute, 2023]. This mirrors what we’ve seen with Product Page Video ROI: A/B Test Data from 50 Shopify Stores, where short-form video consistently beat longer branded content.
Trust and Award Badges Sourced from UGC
“#1 Rated by Customers on Trustpilot” or “Loved by 50,000+ verified buyers” synthesizes UGC into a headline trust indicator. eMarketer’s consumer trust index found that quantified social proof badges outperform generic security badges (padlocks, SSL logos) in influencing purchase completion among Millennials and Gen Z shoppers [eMarketer, 2023].
Common Pitfalls That Kill the Lift
Most UGC-at-checkout tests fail because of five predictable mistakes: adding page-load weight, showing uncurated mediocre reviews, mismatching UGC to specific SKUs, cluttering the payment step, and neglecting mobile treatment. Any one of these can wipe out the trust gains you’re chasing.
1. Slowing Page Load
Every UGC widget adds JavaScript weight. Google’s research consistently shows that a 1-second delay in mobile page load can reduce conversions by up to 20% [Google Marketing Platform, 2022]. If your review widget takes 800ms to render, you may erase the trust gains with speed losses. Lazy-load UGC modules and prioritize server-rendered star ratings over client-side widgets.
2. Displaying Poor or Mediocre Reviews
An unfiltered feed at checkout is dangerous. If the first review in the carousel is 3 stars with a complaint, you’ve actively created abandonment fuel. Curate. Use rules-based selection (4.5+ stars, verified purchases, minimum length) or ML-driven review ranking. However—and this is critical—don’t remove negative reviews entirely from your site elsewhere; Northwestern’s Spiegel Research Center found products with a mix of positive and moderate reviews (4.2–4.5 stars) convert better than products showing only 5-star reviews, because they feel authentic [Spiegel Research Center, 2021]. Curate at checkout, but keep authenticity elsewhere.
3. Category-Product Mismatch
If a shopper is buying a running shoe, they don’t care about testimonials for your yoga mat. SKU-aware UGC is significantly more effective than generic brand testimonials. Modern review platforms (Yotpo, Okendo, Junip, Loox, Bazaarvoice) support product-level filtering; use it.
4. Overloading the Payment Step
The step where users enter card details should be the cleanest. A large photo carousel or video autoplay here can distract from form completion and increase form errors. Keep UGC minimal and static at the final payment step—single line of aggregate rating, or nothing at all. This is also where aggressive urgency tactics tend to backfire; our analysis of scarcity badges psychology shows why layering multiple pressure cues can trigger reactance instead of conversion.
5. Ignoring Mobile Layout
Statista reports that mobile commerce accounts for 60%+ of ecommerce traffic globally and continues to rise [Statista, 2024]. Yet many UGC checkout widgets are designed for desktop layouts and collapse poorly on mobile. Test every UGC placement on iOS and Android checkouts, and consider mobile-specific compact treatments.
A Testing Framework: How to Measure the Lift Correctly
Measure UGC-at-checkout impact with a five-step framework: establish 30-day baselines, segment by customer type, A/B test one variable at a time, track downstream metrics like returns and repeat purchase, and only call winners at 95%+ statistical confidence.
Step 1: Establish Clean Baselines
Before running UGC checkout tests, ensure you have at least 30 days of stable data on:
- Overall checkout completion rate (initiated checkouts / completed orders)
- Step-by-step drop-off rates (shipping → billing → review → complete)
- Mobile vs desktop breakdown
- New vs returning customer split
Step 2: Segment Your Test
New customers respond more strongly to UGC than returning customers who already trust the brand. Run tests segmented by customer type to avoid diluting results. Shopify’s own experimentation guidance recommends minimum sample sizes of 5,000 sessions per variant for meaningful lift detection [Shopify, 2023].
Step 3: A/B Test One Variable at a Time
Test placement first, then content type, then volume. Common test sequences:
- Control (no UGC) vs. star rating badge above payment
- Winner vs. same badge plus single testimonial
- Winner vs. SKU-level ratings in order summary
- Winner vs. addition of photo gallery
Step 4: Measure Beyond Immediate Conversion
Track downstream metrics too: return rate, refund rate, and repeat purchase rate. If UGC at checkout drives conversions from previously hesitant shoppers, those shoppers may return more often (they now feel confirmed in their choice) or return at similar rates (indicating the UGC set accurate expectations). Ahrefs’ ecommerce content research emphasizes that shoppers who read reviews before purchase have significantly lower return rates than impulse buyers [Ahrefs Blog, 2023].
Step 5: Statistical Rigor
Don’t call winners at 85% confidence. Wait for 95%+ statistical significance, and run tests through at least one full business cycle (typically 2–4 weeks depending on traffic). Peel the onion by device, traffic source, and product category.
Implementation on Popular Platforms
Every major ecommerce platform now supports UGC at checkout, though the mechanics differ. Shopify Plus uses Checkout Extensibility, WooCommerce exposes native hooks, BigCommerce offers Open Checkout, and headless stacks demand disciplined server-side rendering.
Shopify and Shopify Plus
Shopify’s native checkout historically restricted customization, but Checkout Extensibility (rolled out to Plus merchants in 2023) now enables UGC apps to inject widgets into the checkout flow via approved extension points. Shopify Plus has documented case studies of brands using Okendo, Judge.me, and Loox extensions at checkout with measurable lift [Shopify Plus, 2023].
WooCommerce
WooCommerce’s flexibility allows nearly unlimited checkout customization via hooks like woocommerce_review_order_before_payment. Plugins like Trustpilot, Yotpo, and Reviews.io integrate natively [WooCommerce, 2023].
BigCommerce
BigCommerce’s Open Checkout provides full front-end control. The platform’s blog highlights merchants who’ve inserted trust widgets between shipping and payment steps with significant conversion gains [BigCommerce Blog, 2023].
Headless Stacks
Custom builds using Next.js Commerce, Hydrogen, or similar frameworks have the most flexibility—and the most responsibility. Ensure any injected UGC content is server-side rendered where possible, cached aggressively, and lazy-loaded below the fold.
A Sample Rollout Plan for the Next 90 Days
A disciplined 90-day rollout runs from analytics audit through curation, first A/B test, and mobile-specific expansion. The goal is a documented playbook you can reuse for every future SKU launch.
- Days 1–14: Audit current checkout analytics. Identify highest drop-off step. Interview 20 abandoning users via post-abandonment survey to surface qualitative doubt themes.
- Days 15–30: Choose UGC platform if not already in place. Curate top 30 SKU-specific reviews. Build variant with aggregate star rating in order summary.
- Days 31–60: Run first A/B test. Aim for 10,000+ sessions per variant. Measure lift with 95% confidence threshold.
- Days 61–90: Layer winning variant with second test (photo UGC or video). Roll out to mobile-specific treatment. Document results and build UGC-at-checkout playbook for future SKU launches.
The Bottom Line
UGC at checkout is not a nice-to-have; it’s an underexploited lever with credible documented lift ranges of 8–26% on completion rate, and even higher for high-consideration categories. The mechanics are grounded in decades of consumer psychology research, and the tooling is now mature across every major ecommerce platform. The catch: implementation quality determines outcomes. Placement, curation, page speed, and mobile treatment collectively separate the winners from the flat tests.
Brands that treat checkout as a psychological experience—not a form to be minimized—will consistently outperform those that don’t. In a world where paid acquisition costs continue to rise (Forrester’s 2024 marketing report noted CAC increases of 15–20% year-over-year across DTC verticals [Forrester Research, 2024]), squeezing conversion from existing traffic through checkout-stage UGC is one of the highest-ROI moves available. The reviews already exist. The customers already trust their peers. All that remains is putting the two together at the moment it matters most.
Frequently Asked Questions
Does UGC at checkout really increase conversion rates?
Yes. Documented merchant case studies and platform benchmarks show conversion lifts ranging from 8% to 26% when UGC (star ratings, testimonials, customer photos) is added to checkout pages. The median lift lands in the low double digits, with higher-consideration categories like apparel, cosmetics, and furniture seeing the strongest gains because doubt at checkout is more acute in those verticals.
What kind of UGC works best at checkout versus product pages?
Checkout demands compact, low-cognitive-load formats: aggregate star ratings, one-line curated testimonials under 20 words, small customer photos, and sub-15-second muted video clips. Long-form paragraph reviews and busy galleries belong on product pages where shoppers are still evaluating. At checkout, the goal is a fast trust refresh, not persuasion from scratch.
Where should I place UGC in the checkout flow?
The highest-value placements are SKU-level star ratings in the order summary, a compact aggregate rating or single testimonial directly above the payment form, and delivery-focused testimonials at the shipping method step. Avoid busy carousels on the payment step itself, and keep the credit card field area as clean as possible to minimize form errors.
Can UGC at checkout hurt conversion?
Yes, if implemented poorly. Common failure modes include heavy JavaScript widgets that slow page load, uncurated feeds showing mediocre or 3-star reviews first, testimonials mismatched to the SKUs in the cart, and desktop-only designs that break on mobile. Any of these can erase the trust gains you’re trying to capture.
Should I show negative reviews at checkout?
Curate for positive verified reviews (4.5+ stars) at checkout specifically, but keep authentic mixed reviews on product detail pages. Spiegel Research Center found that products showing a realistic mix of ratings (4.2–4.5 stars) actually convert better on PDPs than those showing only 5-star reviews, because they feel more credible.
How long should I run an A/B test for UGC at checkout?
Aim for at least 5,000 sessions per variant and run through a full business cycle of 2–4 weeks. Only declare winners at 95%+ statistical confidence, and segment results by device, traffic source, and new vs. returning customers. Rushed tests at 85% confidence lead to false positives that don’t hold up in rollout.
Does UGC at checkout work for B2B or high-ticket ecommerce?
Yes—arguably more so. Higher-ticket and B2B purchases carry more perceived risk, so peer validation at the point of commitment carries disproportionate weight. Case studies, company logos, and named quantified testimonials (“Used by 400+ marketing teams”) tend to outperform anonymous star ratings in B2B checkout contexts.
References
Baymard Institute (2024). 49 Cart Abandonment Rate Statistics. https://baymard.com/lists/cart-abandonment-rate
Nosto/Stackla (2021). Consumer Content Report: Influence in the Digital Age. https://www.nosto.com/resources/
Gartner (2023). The B2C Buying Journey Report. https://www.gartner.com/en/marketing
Bazaarvoice (2023). Shopper Experience Index. https://www.bazaarvoice.com/resources/shopper-experience-index/
Yotpo (2022). Ecommerce Reviews and UGC Benchmarks. https://www.yotpo.com/resources/
Shopify (2023). Ecommerce Conversion Rate Optimization Guide. https://www.shopify.com/blog/conversion-rate-optimization
BigCommerce Blog (2023). Checkout Optimization Case Studies. https://www.bigcommerce.com/blog/
Trustpilot (2022). Ecommerce Trust Benchmark Study. https://business.trustpilot.com/reviews/build-trusted-brand
Okendo (2023). Reviews Impact Report for Shopify Merchants. https://www.okendo.io/resources
Klaviyo Blog (2023). Abandoned Cart Email Benchmarks. https://www.klaviyo.com/blog
McKinsey Digital (2023). The Next Frontier of Personalized Ecommerce. https://www.mckinsey.com/capabilities/mckinsey-digital
Nielsen Norman Group (2022). Ecommerce Checkout Usability. https://www.nngroup.com/articles/
Econsultancy (2023). Conversion Rate Optimization Report. https://econsultancy.com/reports/
HubSpot (2023). State of Consumer Trends Report. https://www.hubspot.com/state-of-consumer-trends-report
Semrush Blog (2023). Ecommerce Trust Signal Benchmarks. https://www.semrush.com/blog/
Shopify Plus (2023). Checkout Extensibility Case Studies. https://www.shopify.com/plus/customers
Nosto (2023). Ecommerce Personalization Benchmarks. https://www.nosto.com/resources/
Content Marketing Institute (2023). Video Content Effectiveness Report. https://contentmarketinginstitute.com/research/
eMarketer (2023). Consumer Trust in Digital Commerce. https://www.emarketer.com/
Google Marketing Platform (2022). Mobile Page Speed and Conversion. https://marketingplatform.google.com/about/resources/
Spiegel Research Center (2021). How Online Reviews Influence Sales. https://spiegel.medill.northwestern.edu/online-reviews/
Statista (2024). Mobile Commerce Share of Retail Ecommerce Sales. https://www.statista.com/statistics/mobile-commerce/
Ahrefs Blog (2023). Ecommerce Content and Conversion. https://ahrefs.com/blog/
WooCommerce (2023). Checkout Customization Documentation. https://woocommerce.com/documentation/
Forrester Research (2024). The State of Marketing 2024. https://www.forrester.com/research/