

Mid-market organizations—typically defined as companies generating between $10 million and $1 billion in annual revenue—occupy a uniquely difficult position in the digital economy. They are too large to run on spreadsheets and gut instinct, yet rarely large enough to staff a dedicated analytics engineering team. Nowhere is this tension more visible than in reporting. Marketing teams live inside ad platforms, email tools, and Google Analytics 4. E-commerce teams live inside Shopify, BigCommerce, or Adobe Commerce, plus their ERP and 3PL dashboards. Finance builds a third view in a BI tool. The result is a quiet but costly epidemic of conflicting numbers, delayed decisions, and wasted spend. Building a unified marketing dashboard that reconciles e-commerce, paid media, and lifecycle data is now the operational backbone of mid-market growth.
According to Gartner, 63% of marketing leaders say they struggle to consolidate performance data across channels, and this fragmentation is the single largest barrier to proving marketing ROI [Gartner, 2024]. For mid-market organizations, unifying digital marketing and e-commerce reporting under one dashboard is no longer a nice-to-have—it is the operational foundation that determines whether the next tier of growth is profitable or not.
Key Takeaways
- A unified marketing dashboard consolidates ad spend, behavioral analytics, transactional data, and lifecycle data into one trusted source of truth.
- Mid-market companies using integrated reporting are 2.3x more confident in their data and reallocate budget 4.5x faster than peers.
- Blended MER, new-customer CAC, and inventory-weighted ROAS are the three metrics that reveal true profitability.
- A pragmatic 90-day roadmap—audit, build, operationalize—delivers results without enterprise overhead.
- Expect 15–25% marketing ROI improvement and 11+ hours per analyst per week in time savings.
- The biggest pitfalls are perfectionism on attribution, weak governance, and failing to retire legacy spreadsheets.
The Mid-Market Reporting Problem in 2025
Mid-market reporting is broken because every tool produces its own version of truth, latency delays decisions by weeks, and no single dashboard serves executives, operators, and analysts simultaneously. The outcome is wasted spend, mistrust, and slower growth. A unified marketing dashboard directly addresses all three.
Mid-market companies typically run between 20 and 40 SaaS tools across marketing, commerce, and analytics, and each one produces its own version of truth. Gartner’s 2024 Marketing Technology Survey found that organizations utilize just 33% of their martech stack capabilities on average, down from 42% in 2022 [Gartner, 2024]. A significant portion of that underutilization comes from reporting duplication: teams buy tools for data they already have but cannot easily access.
Forrester has observed that insights-driven businesses grow more than 30% annually and are predicted to capture a disproportionate share of category revenue [Forrester, 2023]. But “insights-driven” assumes the insights are visible, trusted, and acted upon. In most mid-market companies, three structural problems block that outcome:
- Attribution fragmentation. Meta reports one ROAS number, Google Ads reports another, GA4 reports a third, and Shopify reports a fourth. None of them agree.
- Latency. Reports are compiled weekly or monthly in slide decks instead of flowing in real time, which means decisions trail reality by 7–30 days.
- Audience mismatch. The CMO wants blended CAC and contribution margin. The paid media manager wants campaign-level MER. The merchandiser wants sell-through by SKU. One dashboard rarely serves all three.
Why Do Mid-Market Teams Still Struggle With Data Silos?
Because the tools they bought were optimized for individual channel operators, not for the executive synthesis that drives capital allocation. Each SaaS vendor builds a walled garden to retain usage, which actively works against consolidation.
What Is the Cost of Fragmented Reporting?
McKinsey estimates that companies integrating data across marketing and commerce functions can unlock 15–25% improvement in marketing ROI within 12 months, largely by reallocating spend away from channels and SKUs that look profitable in silo views but are not profitable blended [McKinsey Digital, 2023].
How Fast Does the Problem Compound?
Every new channel—retail media, connected TV, affiliate, influencer—adds another silo. Without a unification layer, each new channel adds 3–5 hours of weekly reconciliation work and multiplies the number of “whose number is right” meetings.
What a Unified Dashboard Actually Means

A unified dashboard is a single reporting layer that simultaneously answers spend, revenue, incrementality, and forward-looking questions across every marketing and commerce system. It is not a Looker Studio file with Meta and Google Ads side by side—it is a modeled metrics layer backed by first-party data.
For mid-market organizations, true unification means answering four questions simultaneously:
- How much did we spend across every paid, owned, and earned channel this period?
- How much revenue, gross profit, and contribution margin did we generate, by product and by customer segment?
- What is the incremental contribution of each marketing activity after accounting for organic baseline and overlap?
- What is the forward-looking view—pipeline, cohort LTV, and inventory sell-through—based on current trajectory?
HubSpot’s 2024 State of Marketing report found that marketers using an integrated reporting platform are 2.3x more likely to report high confidence in their data compared to those using disconnected tools [HubSpot, 2024]. That confidence translates directly to speed of decision-making, which for mid-market firms is often the most meaningful competitive advantage over slower enterprise competitors.
What Are the Four Data Domains That Must Converge?
A unified dashboard pulls from four distinct data domains, each with its own schema and refresh cadence:
- Ad platform data: Meta Ads, Google Ads, TikTok, Pinterest, Amazon Ads, retail media networks. Updates every 1–3 hours.
- Behavioral analytics: GA4, Shopify analytics, server-side event streams, session recording tools. Updates in near real time.
- Transactional and operational data: Shopify orders, ERP, inventory, 3PL shipment status, returns. Updates every 15 minutes to 24 hours.
- Customer and lifecycle data: Klaviyo, CRM, loyalty platform, subscription billing. Updates in near real time.
Shopify Plus data shows that merchants who integrate ad platform spend with first-party order data via server-side APIs see a 9–12% improvement in reported return on ad spend accuracy, which directly influences bidding decisions and budget allocation [Shopify Plus, 2024].
How Does This Differ From a Traditional BI Report?
Traditional BI reports pull historical snapshots on demand. A unified dashboard streams near-real-time events through a governed metric layer, so the paid media manager and CFO see the same number at the same time with the same definition.
Seven Measurable Benefits for Mid-Market Organizations
Unified reporting delivers compounding benefits: faster budget decisions, lower blended CAC, better inventory alignment, higher attribution fidelity, massive analyst time savings, cross-functional alignment, and reduced executive ad-hoc requests. The combined impact typically pays back the stack within one quarter.
1. Faster, More Confident Budget Reallocation
When marketing and commerce data live in one place, weekly budget shifts become routine rather than contentious. Semrush’s 2024 benchmarking study of mid-market e-commerce brands found that companies reviewing blended performance weekly reallocated 18% of paid budget mid-month on average, compared to just 4% for companies reviewing channel-level reports in silos [Semrush, 2024]. The faster-moving group grew revenue 2.1x faster year-over-year.
2. Lower True Customer Acquisition Cost
Blended CAC—total marketing spend divided by total new customers—is the only CAC number a CFO can defend. When ad platforms, email, affiliates, and influencer spend sit in one dashboard alongside new customer orders from the commerce platform, blended CAC becomes a live metric rather than a quarterly reconstruction. According to Klaviyo’s 2024 benchmark report, DTC brands tracking blended CAC in real time maintained CAC-to-LTV ratios below 1:3 at 1.6x the rate of brands tracking channel-reported CAC [Klaviyo, 2024].
3. Better Inventory and Merchandising Decisions
Marketing drives demand, but demand without inventory alignment creates either stockouts or write-downs. Digital Commerce 360 reports that mid-market retailers overspend by an estimated 11–14% on advertising products that are either low-margin or at risk of stockout within the attribution window, simply because the ad platform operator cannot see inventory depth [Digital Commerce 360, 2023]. A unified dashboard surfaces inventory-weighted ROAS so campaigns can be throttled before they drive unfillable demand.
4. More Accurate Attribution Across the Funnel
Post-iOS 17 and 18, platform-reported conversions are increasingly modeled rather than observed. Econsultancy found that 71% of marketers no longer trust individual ad platform ROAS as a standalone decision input [Econsultancy, 2024]. A unified dashboard, especially one that incorporates GA4 data-driven attribution alongside incrementality tests, allows mid-market teams to triangulate between platform-reported, modeled, and first-party views—dramatically improving the fidelity of the resulting decisions.
5. Operational Efficiency and Analyst Time Savings
Mid-market analytics teams routinely spend 40–60% of their time collecting and reconciling data rather than analyzing it. MarketingProfs reported in 2024 that marketing operations teams at companies with unified reporting layers reduced report-building time by an average of 11 hours per analyst per week [MarketingProfs, 2024]. For a team of four analysts, that recovers more than 2,000 hours annually—roughly one full-time equivalent redeployed to strategic analysis.
6. Alignment Between Marketing, Merchandising, and Finance
Internal politics around “whose number is right” dissolve when there is only one number. Content Marketing Institute’s 2024 B2C research found that organizations with cross-functional unified dashboards reported 34% higher internal alignment scores on marketing priorities compared to peers using department-specific reporting [Content Marketing Institute, 2024]. Alignment translates to faster campaign launches and fewer cancelled promotions.
7. Executive Visibility Without Ad-Hoc Requests
CFOs and CEOs of mid-market firms are famous consumers of ad-hoc marketing reports. Each request pulls an analyst off strategic work for 2–6 hours. A unified dashboard with executive-tier views reduces ad-hoc reporting requests by 60–80% according to eMarketer’s 2024 analytics operations survey [eMarketer, 2024].
Architecture: How Mid-Market Companies Actually Build This
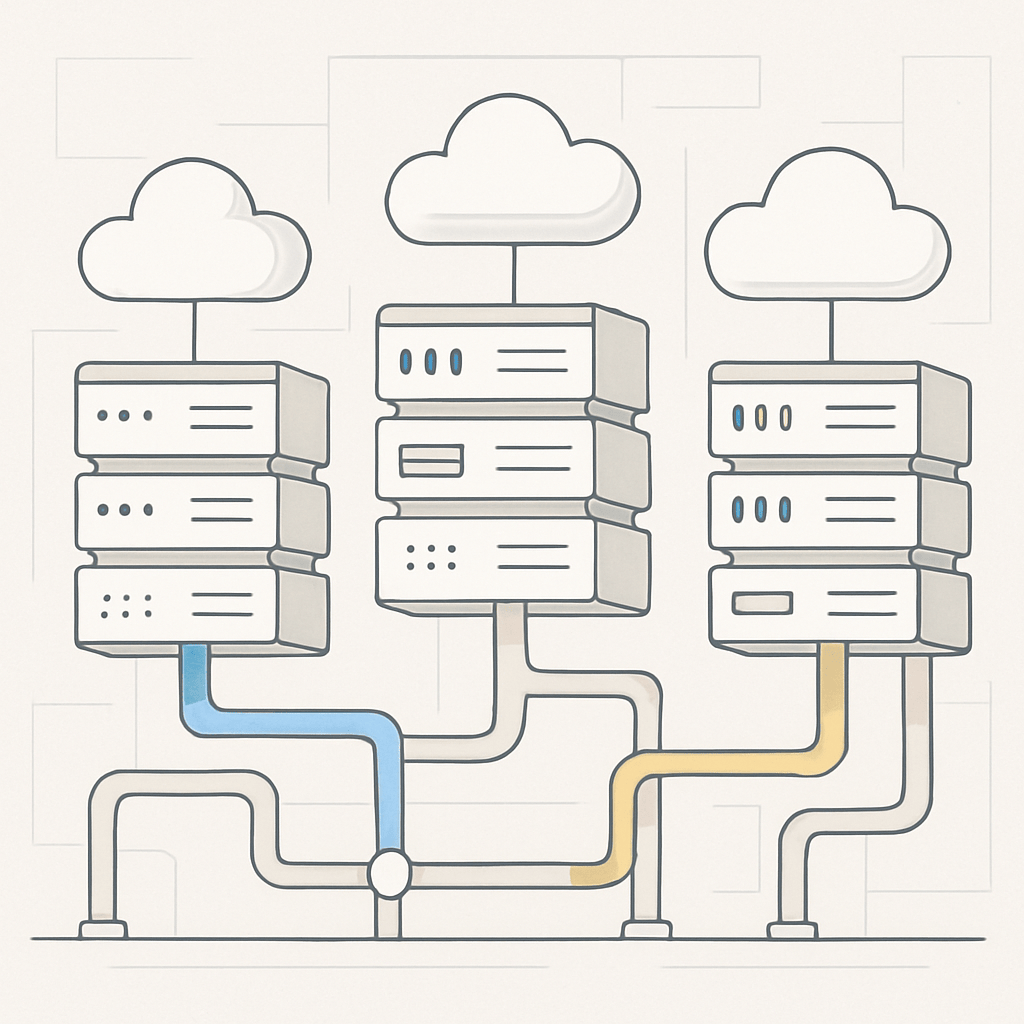
Mid-market companies have three realistic architecture choices: a lightweight warehouse BI stack, an e-commerce analytics suite, or an enterprise CDP plus BI combination. The right choice depends on revenue stage, team capability, and tolerance for custom modeling.
Enterprise architectures involve dedicated data engineering teams, warehouse-native CDPs, and six-figure licensing. Mid-market companies need something more pragmatic. Three reference architectures dominate in 2025:
Pattern A: Lightweight BI Stack ($2,000–$6,000/month)
- Ingestion: Fivetran, Airbyte, or Supermetrics pulls data from ad platforms and Shopify into a cloud warehouse.
- Warehouse: BigQuery, Snowflake, or Postgres on a managed service.
- Modeling: dbt Core for lightweight transformations and metric definitions.
- Visualization: Looker Studio, Metabase, or Hex.
This pattern is appropriate for brands between $5M and $50M in revenue. Ahrefs and Moz both publish case studies showing that mid-market SEO-driven e-commerce brands using lightweight warehouse stacks improved content-to-revenue attribution clarity within 90 days of implementation [Ahrefs, 2024; Moz, 2023].
Pattern B: Analytics Suite with Integrated Dashboarding ($3,000–$12,000/month)
- Tools like Triple Whale, Northbeam, Polar Analytics, or Daasity bundle ingestion, modeling, and visualization specifically for e-commerce.
- Pre-built blended metrics (MER, nCAC, first-order LTV) ship out of the box.
- Appropriate for brands between $3M and $100M in revenue that want speed over custom flexibility.
Pattern C: Enterprise CDP + BI ($10,000–$50,000+/month)
- Segment, mParticle, or RudderStack as the event layer; Snowflake or Databricks as the warehouse; Looker, Tableau, or Power BI as the visualization layer.
- Appropriate for mid-market organizations approaching enterprise scale ($100M+) or those with complex multi-brand portfolios.
According to BigCommerce, 58% of mid-market merchants surveyed in 2024 planned to consolidate reporting tools within 18 months, with Pattern B (integrated analytics suites) representing the most common target state [BigCommerce, 2024]. For teams weighing where event unification should live, the deeper architectural debate between CDP vs Reverse ETL is worth working through before committing to a vendor.
Which Architecture Pattern Is Right for a $20M Brand?
For a $20M brand with one analyst, Pattern B is almost always the right starting point—speed to insight beats custom flexibility. For a $20M brand with 3+ analysts and complex B2B+DTC data, Pattern A offers more long-term flexibility at similar cost.
Metrics That Belong on a Unified Dashboard
A well-designed unified dashboard surfaces 10–15 core metrics across acquisition, conversion, retention, and operations at the top level, with structured drill-downs beneath. Dashboard sprawl is as dangerous as data silos, so ruthless curation matters.
The canonical mid-market metric set includes:
Acquisition Metrics
- Blended Marketing Efficiency Ratio (MER): total revenue / total marketing spend
- New customer MER (nMER): new customer revenue / total marketing spend
- Blended CAC and new customer CAC
- Channel contribution margin after platform fees
Conversion and Experience Metrics
- Site-wide conversion rate, segmented by new vs returning
- Add-to-cart to purchase ratio
- Average order value and units per transaction
- Core Web Vitals and page speed by template
Retention and Lifecycle Metrics
- 30/60/90-day repeat purchase rate
- Predicted 12-month LTV by acquisition cohort
- Email and SMS revenue attribution
- Subscription active count and churn (where applicable)
Commerce and Operations Metrics
- Gross margin after discount, shipping, and payment fees
- Inventory sell-through by SKU and category
- Return rate by product and by acquisition channel
- Fulfillment time and on-time delivery rate
Statista data shows that mid-market e-commerce brands tracking contribution margin at the SKU level alongside paid media spend achieve 7–11% higher net profit margins than peers tracking revenue-only metrics [Statista, 2024]. For teams calibrating which metrics should matter at each revenue stage, our breakdown of E-Commerce KPIs by Business Stage provides stage-matched benchmarks.
Implementation Roadmap: 90 Days to Unified Reporting

A realistic 90-day roadmap unfolds in three 30-day phases: audit and metric definition, build and connect, then operationalize and train. Mid-market organizations rarely have the luxury of a 12-month data transformation, and compressing the timeline forces disciplined scope.
Days 1–30: Audit and Metric Definition
- Inventory every reporting tool currently in use and the audience it serves.
- Document the top 15 metrics each executive stakeholder consumes weekly.
- Agree on canonical definitions—especially for CAC, LTV, and attribution window.
- Choose an architecture pattern based on team capability and budget.
Days 31–60: Build and Connect
- Stand up the ingestion layer and connect ad platforms, Shopify, Klaviyo, and GA4.
- Validate row-level data against platform-native dashboards within 5% tolerance.
- Build the first version of the executive summary view with 10 top-line metrics.
- Document data lineage and refresh cadence transparently so stakeholders know when numbers update.
Days 61–90: Operationalize and Train
- Replace at least three legacy reports with the new dashboard.
- Run weekly review meetings off the unified view only—no side spreadsheets.
- Train each department on self-serve drill-downs so analysts stop being bottlenecks.
- Measure and report on time saved, decisions accelerated, and reallocation delta.
Mailchimp’s 2024 customer research found that mid-market brands completing a 90-day unified reporting rollout saw a 14% average lift in email-attributed revenue within the following quarter, largely because lifecycle marketers finally had visibility into which paid acquisition sources produced the highest-engaging email subscribers [Mailchimp, 2024]. If your rollout involves retiring Universal Analytics, our guide on how to Migrate UA Reports to GA4 Explorations Without Losing History can shortcut the first 30 days.
Common Pitfalls and How to Avoid Them
The most common pitfalls are designing for executives only, chasing perfect attribution, neglecting governance, and failing to actively deprecate legacy reports. Each pitfall destroys trust in the dashboard within 60 days of launch.
Pitfall 1: Building for the CEO Only
Executive dashboards are important, but if the operational teams cannot use the same source of truth, two realities emerge again within 60 days. Design the dashboard with the paid media manager, email lead, and merchandiser in mind first; executives will inherit a well-pressure-tested view.
Pitfall 2: Perfectionism on Attribution
No model is perfect. Search Engine Journal has repeatedly argued that spending six months modeling attribution is almost always worse than spending six weeks shipping a transparent, directional view and running incrementality tests on top [Search Engine Journal, 2024]. Ship, then refine.
Pitfall 3: Ignoring Data Governance
Who owns metric definitions? Who approves changes? Who gets alerted when a data source breaks? Without clear governance, dashboards drift into the same mistrust that killed the previous reports. Assign a single marketing operations or analytics owner for the metric layer.
Pitfall 4: Underestimating Change Management
Neil Patel has noted that the hardest part of marketing analytics transformation is not the tooling—it is getting teams to stop using the old spreadsheets [Neil Patel, 2023]. Deprecate legacy reports actively. Delete them. Force the migration.
The Competitive Advantage of Doing This Now
Mid-market firms that build unified reporting in 2025 capture a durable efficiency advantage over slower enterprise competitors and more fragile DTC startups. A $200K/month advertiser typically recovers $20K–$44K per month in effective efficiency from unification alone.
Mid-market organizations are being squeezed from both sides. Enterprise competitors have mature data infrastructure and large analytics teams. Scrappy DTC startups built on modern tooling are data-fluent from day one. The mid-market firms that will thrive through 2026 and beyond are those that act like data-native companies without the enterprise overhead.
Meta for Business published findings in 2024 showing that advertisers using blended, first-party-fed signals in their decision-making saw a 22% improvement in return on ad spend compared to platform-only reporting [Meta for Business, 2024]. Google Marketing Platform’s own research reaches a similar conclusion: campaigns optimized against first-party conversion signals from the merchant’s own stack outperform platform-default optimization by double-digit percentages [Google Marketing Platform, 2024].
In practical terms, this means a mid-market organization spending $200,000 per month on paid media can expect to recover $20,000–$44,000 per month in effective efficiency from a unified reporting foundation alone—before any strategic insight is layered on top. Over a year, that single investment typically pays for the entire analytics stack five to ten times over.
Frequently Asked Questions
What is a unified marketing dashboard?
A unified marketing dashboard is a single reporting layer that combines paid media spend, behavioral analytics, transactional and operational data, and customer lifecycle data into one governed metrics view. Unlike a standard BI report that pulls from one source, it reconciles conflicting numbers across platforms and surfaces blended metrics like MER and new-customer CAC. For mid-market brands, it becomes the shared source of truth used by executives, operators, and analysts.
How much does a unified marketing dashboard cost for a mid-market company?
Costs range from $2,000–$6,000 per month for a lightweight warehouse BI stack, $3,000–$12,000 per month for an integrated e-commerce analytics suite, and $10,000–$50,000+ for an enterprise CDP plus BI stack. Most $10M–$100M brands land in the integrated-suite tier, which balances speed to value with blended metric sophistication. Payback typically occurs within one quarter via budget reallocation and analyst time savings.
How long does it take to implement a unified dashboard?
A disciplined 90-day roadmap is achievable for most mid-market brands: 30 days for audit and metric definition, 30 days to build and connect data sources, and 30 days to operationalize and train teams. Enterprise CDP architectures can take 6–9 months. Compressing scope is the single most important success factor—ship a directional v1, then refine.
What metrics should appear on an executive unified dashboard?
An executive view should surface 10–15 metrics covering acquisition (blended MER, new-customer CAC), conversion (site conversion rate, AOV), retention (30/60/90-day repeat rate, cohort LTV), and operations (gross margin after fees, inventory sell-through). Avoid vanity metrics like impressions or sessions at the top level. Every top-line metric should answer a decision an executive makes weekly.
Is a unified dashboard the same as a CDP?
No. A CDP (Customer Data Platform) focuses on unifying customer identity and activating segments to downstream tools. A unified reporting dashboard focuses on consolidating performance metrics for decision-making. Many mid-market brands eventually need both, but reporting unification almost always precedes CDP investment because it clarifies which activation use cases are actually worth building.
How do unified dashboards handle attribution post-iOS 17 and 18?
They triangulate between platform-reported ROAS, GA4 data-driven attribution, and first-party server-side conversion signals, then validate with periodic incrementality tests. No single source is treated as truth; the dashboard shows the range and flags material disagreements. This triangulation approach outperforms any single-source attribution model in blind tests.
What is the biggest reason unified reporting projects fail?
Failure to deprecate legacy reports. Teams revert to familiar spreadsheets within weeks unless the old reports are actively deleted and leadership enforces that weekly reviews happen only from the unified view. Change management, not tooling, is the dominant failure mode cited by analytics leaders.
Conclusion
Unifying digital marketing and e-commerce reporting is not a technology project. It is an operating-model decision that determines how fast a mid-market organization can learn, decide, and deploy capital. The companies that treat reporting unification as a core strategic initiative—owned by leadership, resourced appropriately, and rolled out on a 90-day cadence—consistently outperform peers on blended ROAS, margin, and growth rate. The companies that treat it as an IT ticket keep paying the tax of fragmented truth, slow decisions, and inter-departmental friction. In 2025 and beyond, the difference between those two postures is the difference between scaling profitably and stalling at the next revenue tier.
References
Gartner (2024). Marketing Technology Survey. https://www.gartner.com/en/marketing
Forrester (2023). Insights-Driven Businesses Report. https://www.forrester.com/
McKinsey Digital (2023). Unlocking Marketing ROI Through Data Integration. https://www.mckinsey.com/capabilities/mckinsey-digital
HubSpot (2024). State of Marketing Report. https://www.hubspot.com/state-of-marketing
Shopify Plus (2024). Server-Side Conversion API Benchmark Study. https://www.shopify.com/plus
Semrush (2024). Mid-Market E-Commerce Benchmarking Study. https://www.semrush.com/blog/
Klaviyo (2024). DTC Benchmark Report. https://www.klaviyo.com/blog
Digital Commerce 360 (2023). Mid-Market Retailer Ad Spend Analysis. https://www.digitalcommerce360.com/
Econsultancy (2024). Attribution Trust Survey. https://econsultancy.com/
MarketingProfs (2024). Marketing Operations Benchmark. https://www.marketingprofs.com/
Content Marketing Institute (2024). B2C Content Marketing Research. https://contentmarketinginstitute.com/
eMarketer (2024). Analytics Operations Survey. https://www.emarketer.com/
Ahrefs (2024). E-Commerce SEO Case Studies. https://ahrefs.com/blog/
Moz (2023). Mid-Market SEO Attribution Report. https://moz.com/blog
BigCommerce (2024). Mid-Market Merchant Technology Survey. https://www.bigcommerce.com/blog/
Statista (2024). E-Commerce Margin Benchmarks. https://www.statista.com/
Mailchimp (2024). Customer Lifecycle Marketing Research. https://mailchimp.com/resources/
Search Engine Journal (2024). Attribution Modeling in Practice. https://www.searchenginejournal.com/
Neil Patel (2023). Marketing Analytics Transformation. https://neilpatel.com/blog/
Meta for Business (2024). First-Party Signal Performance Study. https://www.facebook.com/business/news
Google Marketing Platform (2024). Conversion Signal Optimization Research. https://marketingplatform.google.com/about/resources/