
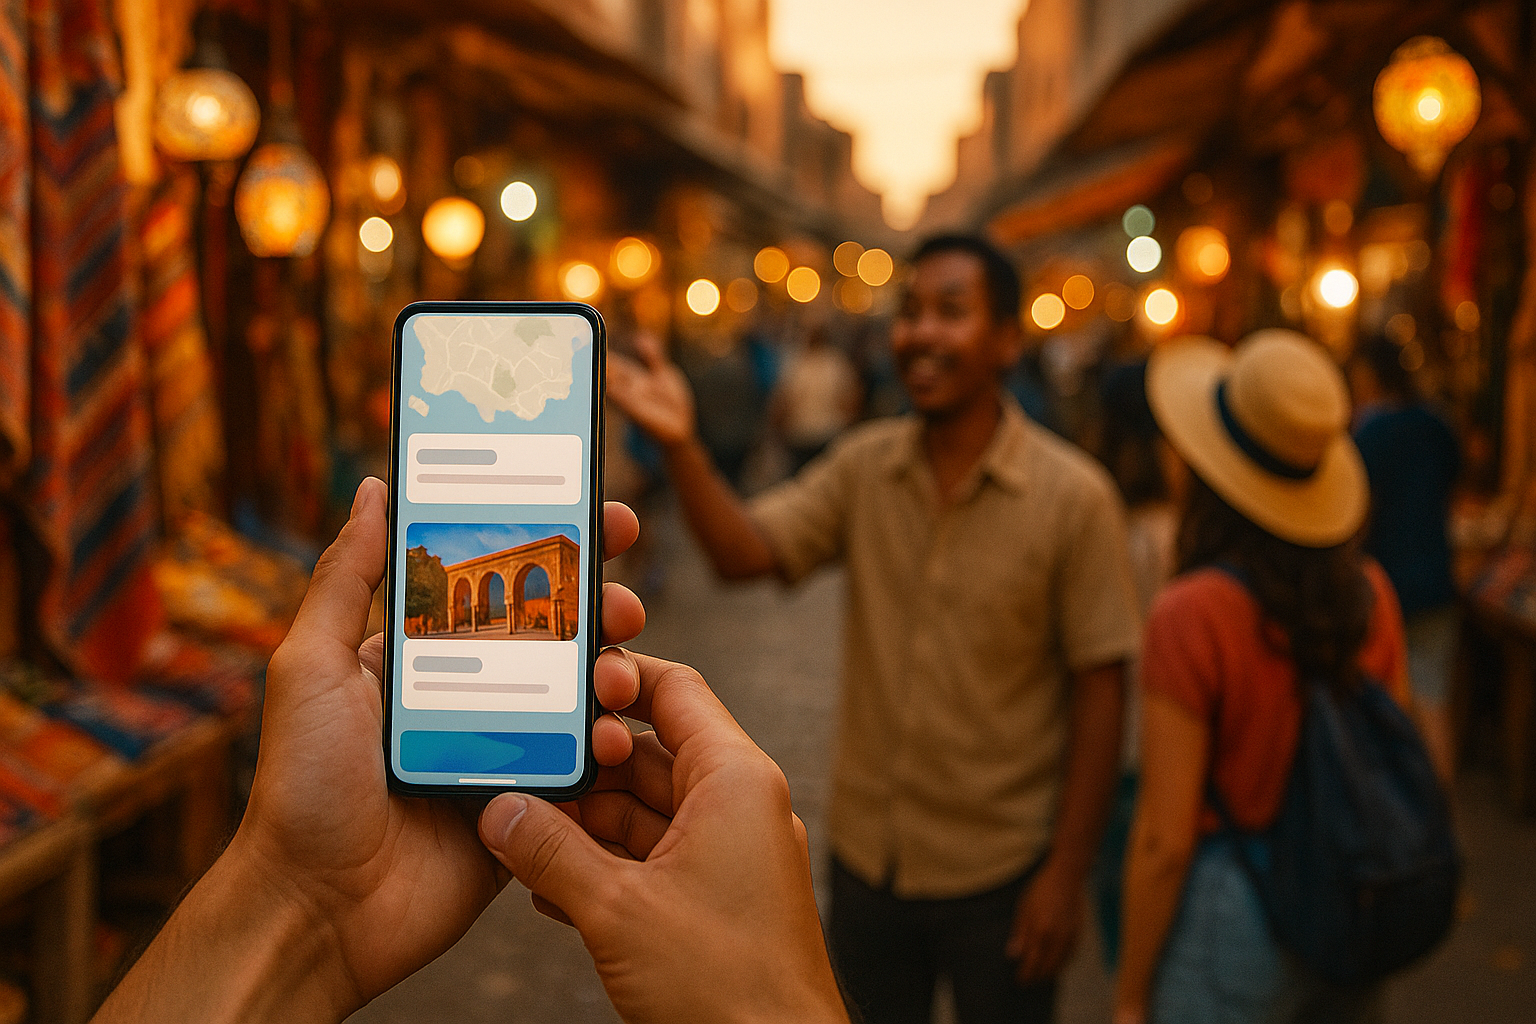
Digital marketing and e-commerce for tour operators in emerging markets—from Marrakech to Medellín, Nairobi to Hanoi—represents a once-in-a-generation opportunity. International tourism has fully rebounded, mobile penetration is at historic highs, and inbound travelers increasingly plan and book experiences directly on their phones rather than through legacy intermediaries. Yet most operators in these regions still lose the majority of their potential direct bookings to friction they could fix in a quarter: broken payment flows, trust gaps that erode conversion, and websites that were designed for desktop users who no longer exist.
This article is a tactical playbook for independent and mid-sized tour operators in Latin America, Africa, Southeast Asia, the Middle East, and South Asia who want to grow direct bookings without surrendering 20–30% of revenue to global OTAs. We’ll focus on three interlocking pillars: payment infrastructure, trust signals, and mobile-first design—and how digital marketing dollars can be deployed efficiently once those foundations are in place.
Key Takeaways
- Tour operators in emerging markets lose 15–30% margin to OTA commissions; recovering just 10% to direct channels can lift net margin by 3–5 points.
- Payment infrastructure is the single highest-ROI fix: match local methods (Pix, M-Pesa, GCash) to your audience geography and offer 3+ payment options.
- Trust signals—reviews, licenses, WhatsApp support, named guide profiles—can lift conversion 20–35% versus anonymous, policy-light sites.
- Mobile-first design means designing for a 390px viewport first; sub-3-second load times and three-step checkouts are non-negotiable.
- Google Ads captures high-intent demand, SEO compounds over time, and WhatsApp + email automation drive the highest ROAS post-foundation.
- A disciplined 90-day roadmap—foundation, trust, acquisition—can unlock $100K+ in hidden margin without new ad spend.
Why Emerging Market Tour Operators Face a Different Playbook
Emerging market tour operators need a fundamentally different digital playbook because the Western e-commerce assumptions—credit card ubiquity, fast broadband, familiar global payment brands—simply don’t hold. Buyers pay with mobile wallets, browse on 3G, and heavily rely on messaging apps and reviews to build trust before purchase.
Consider the macro picture. The global travel and tourism market is projected to reach $1.02 trillion in revenue in 2024, with online sales accounting for roughly 76% of total revenue by 2029 [Statista, 2024]. Yet in regions like Sub-Saharan Africa and South Asia, credit card ownership among adults remains below 10%, while mobile money and alternative payment methods dominate [Statista, 2024]. For tour operators serving both inbound international travelers and domestic customers, this creates a dual-audience problem: optimize for Visa and Mastercard, or for M-Pesa, Pix, GCash, and bank transfers?
Compounding this, mobile commerce now represents 60% of global e-commerce transactions, and that figure is even higher in emerging markets where many consumers skipped the desktop era entirely [eMarketer, 2024]. Meanwhile, Google reports that 53% of mobile users abandon sites that take longer than three seconds to load [Google Marketing Platform, 2023]—a brutal threshold on 3G networks that still dominate rural tourism regions.
What makes emerging markets structurally different?
Three structural factors stand out: (1) payment fragmentation, with dozens of locally dominant rails rather than two or three global ones; (2) mobile primacy, with smartphones as the first and only internet device for most consumers; and (3) trust deficits, where brand recognition is low and buyers rely heavily on social proof and messaging-based reassurance before committing money.
How big is the direct booking opportunity?
OTAs like Booking.com, Viator, and GetYourGuide charge commissions ranging from 15% to 30% on tour and activity bookings. For a $200 city tour, that’s $30–$60 of pure margin lost per transaction. Research from Econsultancy indicates that travel brands recovering just 10% of OTA bookings into direct channels can lift net margin by 3–5 percentage points [Econsultancy, 2023]. For a tour operator doing $500,000 in annual revenue, that’s $15,000–$25,000 recovered without selling a single additional tour. Many of the mechanics mirror those we outlined in our analysis of Hotel Direct Booking Strategies That Beat OTA Commissions, which applies closely to the tours and activities category.
Pillar 1: Payment Infrastructure That Actually Converts
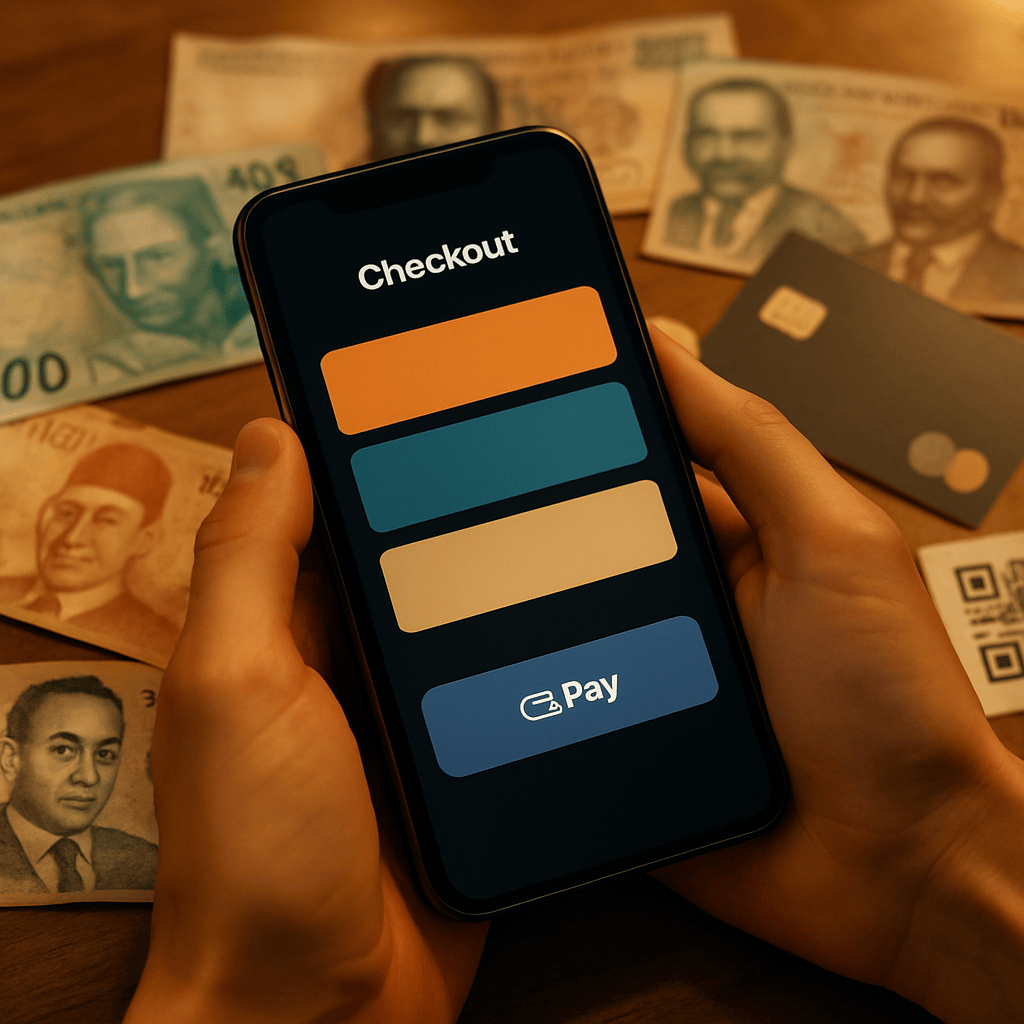
Payment is the single most under-optimized element on emerging market tour operator sites. Operators spend thousands on Google Ads to drive qualified traffic, only to lose 70%+ of ready-to-buy customers at a checkout that doesn’t support their payment method or currency.
How should operators match payment methods to audience geography?
The first rule: your checkout must reflect where your customers actually come from, not where you think they should pay from. Pull your Google Analytics 4 audience report and segment by country. If 40% of your traffic comes from Brazil, offering Pix (which now accounts for over 40% of Brazilian e-commerce transactions) is non-negotiable [Statista, 2024]. If you serve inbound travelers from Germany, SEPA direct debit and Klarna are table stakes.
Baymard Institute’s long-running checkout research shows that 17% of U.S. shoppers abandon carts because the checkout process is “too long or complicated,” and 9% abandon because “there weren’t enough payment methods” [Baymard Institute cited in Shopify, 2024]. In emerging markets, where payment fragmentation is far worse, the abandonment rate from payment issues can be double.
What does a modern multi-rail payment stack look like?
Modern tour operators should think of payment as a portfolio, not a single integration. A practical stack for a Southeast Asian tour operator might include:
- International cards: Stripe or Adyen for Visa, Mastercard, Amex (inbound travelers)
- Regional wallets: GCash (Philippines), GrabPay (SEA-wide), TrueMoney (Thailand)
- Bank transfers: FPX (Malaysia), QRIS (Indonesia)
- BNPL: Atome or Hoolah for larger multi-day packages
- Cash alternatives: OXXO voucher for Mexican customers, Boleto for Brazilians
Klaviyo’s commerce benchmarks show that offering three or more payment methods lifts conversion rates by 7–12% on average, with the lift increasing for higher-value transactions typical of tours and packages [Klaviyo Blog, 2024]. For higher-ticket packages, BNPL is especially impactful; our deep dive into BNPL Impact on E-Commerce AOV and Return Rates: 2024-2025 explores the AOV lift and risk controls in detail.
Should tour operators use deposits or require full payment?
Tour operators have a unique advantage over typical e-commerce: the service is delivered later, often weeks or months after booking. This enables deposit-based payment flows that reduce buyer friction. Rather than demanding $800 upfront for a 5-day trek, offer a 20% deposit of $160 with the balance due 30 days before arrival. HubSpot’s analysis of high-consideration purchases found that payment-splitting options can lift conversion by 15–25% for transactions above $500 [HubSpot, 2023].
Currency Display and Settlement
Showing prices in the customer’s local currency—even if settlement happens in USD or EUR—is a measurable conversion lever. Shopify’s cross-border research found that merchants displaying localized currency saw 40% higher conversion from international shoppers than those showing a single currency [Shopify, 2024]. Use IP-based currency detection but always allow manual switching, and clearly communicate the final charged amount to avoid chargebacks.
Pillar 2: Trust Signals That Overcome “Unknown Brand” Hesitation

Trust is the invisible currency of emerging market tourism e-commerce. An inbound traveler researching tours in Jordan or Vietnam is weighing one critical question: Is this operator real, safe, and reliable, or will I lose $500 and my vacation day? Engineering trust deliberately—through reviews, licenses, humanized team pages, and messaging-based support—measurably lifts conversion.
Why are reviews the primary trust vehicle?
Research from BrightLocal, widely cited across the industry, found that 98% of consumers read online reviews for local businesses, and travel-category businesses see even higher review-reading rates [cited in Search Engine Journal, 2024]. For tour operators, TripAdvisor, Google Business Profile, and Viator reviews function as third-party credibility that your own website can never provide alone.
Tactical priorities:
- Volume beats perfection. A 4.6-star rating with 400 reviews converts better than a 5.0 with 12 reviews. Build a post-tour review request flow via WhatsApp or email within 24 hours of experience completion.
- Embed reviews on PDPs. Pulling Google reviews or TripAdvisor widgets directly onto tour product pages lifts conversion. Content Marketing Institute reports that user-generated content on product pages lifts conversion by up to 29% [Content Marketing Institute, 2023].
- Respond to every review—especially negative ones. Public, professional responses to criticism are trust signals in themselves.
Which operator credentials matter most?
Display tourism board licenses, insurance certifications, and industry memberships prominently. For Peru, that’s MINCETUR registration; for Kenya, TRA licensing; for Morocco, the operator’s Ministry of Tourism license number. These signals matter especially for inbound travelers who research destination-specific regulations.
Humanize the Operator
Emerging market tour operators have an authenticity advantage over global OTAs: real local founders, real guides, real stories. Use it. Pages that feature named guide profiles with photos, bios, and languages spoken outperform anonymous “Our Team” pages dramatically. McKinsey’s consumer research on travel decisions found that “authentic local connection” ranked as a top-three decision factor for 61% of adventure and cultural travelers [McKinsey Digital, 2023].
Security and Policy Transparency
Table-stakes trust elements that are still frequently missing from emerging market operator sites:
- SSL (HTTPS) across every page, not just checkout
- Clear cancellation and refund policy linked from every PDP
- Payment logos (Visa, Mastercard, local wallet brands) in the footer
- Physical office address and local phone number
- WhatsApp Business verified checkmark for messaging
- A visible “Contact us” option that includes a response-time commitment
How does WhatsApp close the trust gap?
In most emerging markets, WhatsApp is the customer service channel. Meta reports that over 2 billion people use WhatsApp monthly, with especially high penetration in Latin America, Africa, India, and Southeast Asia [Meta for Business, 2024]. Tour operators who offer a WhatsApp inquiry button pre-purchase convert 20–35% higher than those forcing customers through email-only contact forms, based on operator case data compiled by Econsultancy [Econsultancy, 2023]. The real-time, mobile-native nature of WhatsApp dissolves the “will anyone respond?” trust gap instantly.
Pillar 3: Mobile-First Design (Actually Mobile-First)
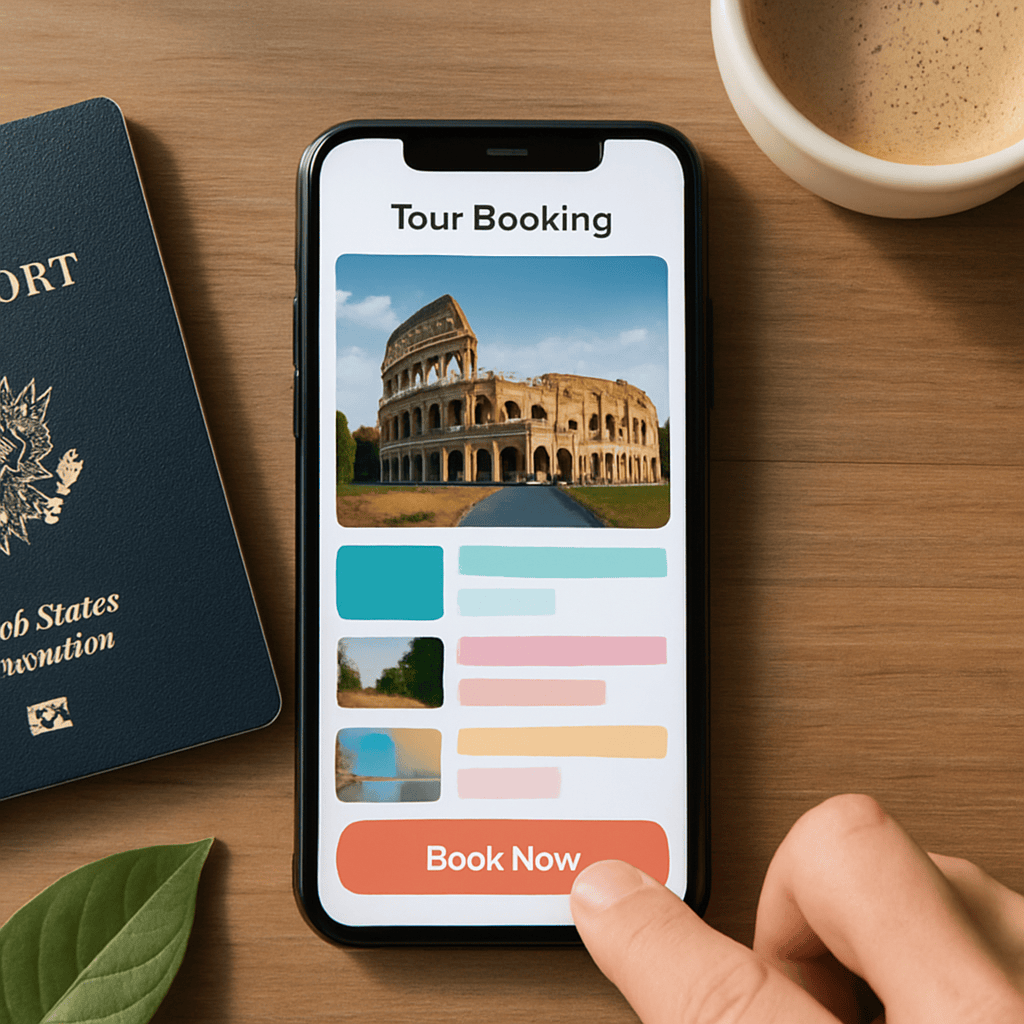
Most tour operator sites claim to be “mobile responsive.” Few are truly mobile-first. True mobile-first design starts from a 390-pixel viewport and scales up, prioritizes thumb-friendly tap targets, sub-3-second load times, and progressive disclosure of complex itinerary content.
The difference matters because 70%+ of travel research and an increasing share of bookings happen on smartphones, particularly in markets where mobile is the primary internet device [eMarketer, 2024].
What does designing for thumb and thumbnail really mean?
Mobile-first means designing for a 390-pixel-wide viewport first, then scaling up—not shrinking a desktop layout. Key implications:
- Single-column layouts with large tap targets (minimum 44×44 pixels per Apple HIG and Google Material guidelines)
- Sticky “Book Now” CTAs on tour product pages that remain visible while scrolling
- Hero images optimized for vertical screens—landscape hero shots often lose impact on mobile
- Collapsed/accordion content for itineraries and FAQs to reduce scroll fatigue
Why is site speed effectively revenue?
Google’s Core Web Vitals research consistently shows that improving Largest Contentful Paint from 4 seconds to 2.5 seconds can lift conversion rates by 10–20% [Google Marketing Platform, 2023]. For emerging market operators serving customers on 3G and spotty 4G, these gains are even larger. Portent’s analysis across 143,000 landing pages found that a site that loads in 1 second has a conversion rate 3x higher than one that loads in 5 seconds [cited in Semrush Blog, 2024].
Priority optimizations:
- Compress and serve images in WebP or AVIF formats with proper dimensions
- Lazy-load gallery images below the fold
- Defer non-critical JavaScript (chat widgets, analytics)
- Use a CDN with edge nodes in your target markets—Cloudflare and BunnyCDN are cost-effective
- Audit third-party scripts quarterly; tour operator sites commonly carry 15+ tracking pixels, half of which deliver no value
Progressive Disclosure for Complex Products
A multi-day safari package has 30+ data points: itinerary, inclusions, exclusions, difficulty, group size, accommodations, meals, transfers, insurance, equipment, dress code. On desktop you can show it all. On mobile, you’ll lose the user before they finish scrolling. Use progressive disclosure: show the top three decision drivers (price, duration, next available date) above the fold, and collapse everything else behind tabs or accordions.
How short should mobile checkout be?
Baymard Institute data shows that mobile checkouts with four or more steps have abandonment rates above 75% [cited in Shopify, 2024]. For tours, aim for: (1) Date and participants, (2) Contact details, (3) Payment. Address collection should be minimal or skipped entirely (you don’t ship anything), and account creation should be optional, triggered after purchase.
Marketing Channels That Work for Emerging Market Operators
Once your foundation is right, the highest-ROI channels for emerging market tour operators are Google Ads for high-intent capture, SEO destination content for long-tail compounding, Meta ads for retargeting and lookalikes, and WhatsApp/email automation for lifecycle revenue.
Google Ads: High-Intent Inbound Capture
Google Ads remains the highest-ROI channel for inbound tourism because of commercial intent. Keywords like “private tour Marrakech,” “Angkor Wat sunrise tour,” or “Pantanal fishing lodge” attract travelers in active booking mode. Semrush data shows that travel-category paid search converts at 3–7%, well above the e-commerce average of 1.5–2% [Semrush Blog, 2024].
Best practices:
- Build campaigns by intent tier: branded, high-intent generic (“book X tour”), mid-intent (“best time to visit Y”), and awareness
- Use location targeting aggressively—exclude countries you don’t serve or that convert poorly
- Deploy offline conversion imports for bookings that complete via WhatsApp or email, so Google’s smart bidding optimizes for actual revenue, not just form submissions
SEO: The Long-Game Compound Returns
Ahrefs’ analysis of travel SEO consistently shows that top-ranking tour pages earn 40–60% of their category’s organic clicks [Ahrefs Blog, 2024]. For operators, this means investing in:
- Destination guides (e.g., “3 days in Cusco: complete itinerary”)
- Comparison content (e.g., “Masai Mara vs Serengeti: which safari is right for you?”)
- Seasonal planning posts (e.g., “When to visit Bali: month-by-month guide”)
These pages attract travelers 3–6 months before booking and can be remarketed into direct booking via email and ads.
Meta Ads: Lookalikes and Retargeting
Meta’s audience quality has stabilized post-iOS 14, especially for travel verticals where emotional imagery and video drive strong engagement. Social Media Examiner’s 2024 industry report found that travel brands rank among the top three verticals for Instagram and Facebook ad ROAS [Social Media Examiner, 2024]. Prioritize lookalikes built off past bookers and retargeting of PDP visitors who didn’t convert within 7 days.
Email and WhatsApp Automation
Klaviyo reports that automated flows generate 30%+ of total email revenue for e-commerce brands using the platform, with welcome and abandoned-cart flows driving the majority [Klaviyo Blog, 2024]. For tour operators, the highest-ROI flows are:
- Pre-arrival education sequence (what to pack, cultural tips)
- Post-tour review request + referral offer
- Anniversary-of-trip re-engagement (one year later: “Ready for your next adventure?”)
- Abandoned-booking recovery via email + WhatsApp
Analytics and Attribution in a Fragmented Journey
Tour booking journeys are long—often 30–90 days from first touch to purchase—and span devices, channels, and offline conversations. Attribution requires GA4 with server-side tagging, offline conversion imports for WhatsApp and phone bookings, strict UTM discipline, and multi-touch models to allocate budget efficiently.
Recommended analytics stack:
- GA4 with enhanced e-commerce events configured for begin_checkout, add_payment_info, and purchase
- Server-side tagging via Google Tag Manager Server Container to recover signal lost to iOS tracking restrictions
- Offline conversion imports for WhatsApp and phone bookings
- UTM discipline across every ad, email, and WhatsApp campaign link
Gartner’s marketing analytics research notes that organizations using multi-touch attribution models allocate budget 15–30% more efficiently than those relying on last-click alone [Gartner, 2024]. Operators managing multiple channels will also benefit from the dashboard patterns described in our Unified Marketing & E-Commerce Dashboards for Mid-Market Wins guide.
A 90-Day Implementation Roadmap
For an operator starting from scratch or rebuilding, a realistic 90-day sequence sequences foundation work (payment, speed, analytics), then conversion (trust, CTAs, deposits), then acquisition (Google Ads, SEO, retargeting). The order matters: adding paid traffic to a leaky site amplifies waste.
Days 1–30: Foundation
- Audit current mobile site speed via PageSpeed Insights; fix top 5 issues
- Add local payment methods matching your top 3 source countries
- Install WhatsApp Business API with click-to-chat buttons on PDPs
- Set up GA4 with full e-commerce event tracking
- Launch a review generation flow for past 12 months of customers
Days 31–60: Trust and Conversion
- Add reviews widgets, security badges, and certifications to PDPs
- Rewrite PDPs with progressive disclosure and sticky CTAs
- Build and test deposit payment option for packages above $300
- Implement abandoned-booking email + WhatsApp flow
Days 61–90: Acquisition
- Launch Google Ads campaigns on high-intent terms with offline conversion imports
- Build 3 destination SEO pillar pages
- Launch Meta retargeting with lookalike audiences built on past bookers
- Measure, iterate, and expand what works
Common Pitfalls to Avoid
The most frequent mistakes include copying Western DTC playbooks wholesale, over-investing in site redesigns before fixing checkout, ignoring domestic customers, and treating OTAs as pure enemies rather than discovery funnels to convert into direct repeat bookings.
- Copying global DTC playbooks blindly. What works for a U.S. apparel brand often fails for a Jordanian tour operator because of different payment, device, and trust contexts.
- Over-investing in a beautiful site before fixing checkout. A 5% checkout conversion lift from payment optimization usually beats a 20% traffic lift from redesign.
- Ignoring domestic customers. Many operators focus exclusively on inbound dollars and miss growing middle-class domestic travel markets.
- Treating OTAs as the enemy. OTAs are efficient discovery channels. Use them for new-customer acquisition, then convert repeat customers to direct via post-tour email, loyalty discounts, and WhatsApp.
The Bottom Line
Tour operators in emerging markets who get payment, trust, and mobile-first design right are positioned to capture a disproportionate share of the next decade’s tourism growth. The infrastructure gaps that frustrated operators in 2015 are closing fast—regional payment rails are maturing, mobile-first design tools are commoditized, and trust-building through reviews and messaging is well understood. The operators who move first will build durable direct-booking engines; those who wait will remain dependent on OTA commissions that compress margins indefinitely.
Start with the foundation. Measure everything. Iterate monthly. The next $100,000 of margin in your business is almost certainly hiding in a checkout friction point, a missing trust signal, or a mobile page that loads too slowly—not in another ad campaign.
Frequently Asked Questions
What is the biggest conversion killer for tour operators in emerging markets?
Payment friction is by far the biggest conversion killer. Operators regularly lose 50–70% of ready-to-buy customers because the checkout doesn’t support local payment methods like Pix, M-Pesa, GCash, or OXXO. Adding three or more locally relevant payment options typically lifts conversion by 7–12% almost immediately.
How much commission do OTAs charge tour operators, and is it worth leaving them?
OTAs like Viator, GetYourGuide, and Booking.com charge 15–30% commission on bookings. Leaving them entirely is usually a mistake—they are efficient discovery channels for new customers. The right strategy is to accept OTA bookings for acquisition, then convert those customers into direct repeat bookers via post-tour email, WhatsApp, and loyalty incentives.
Is WhatsApp really necessary for a tour operator website?
In most emerging markets, yes. WhatsApp has over 2 billion monthly users and dominates customer service in Latin America, Africa, India, and Southeast Asia. Tour operators that add a WhatsApp inquiry button convert 20–35% higher than those relying on email-only contact forms, because real-time messaging dissolves the “will anyone respond?” trust gap.How fast should a tour operator website load on mobile?
Target under 3 seconds for Largest Contentful Paint on 4G. Google reports that 53% of mobile users abandon pages that take longer than 3 seconds. Improving load time from 4 seconds to 2.5 seconds has been shown to lift conversion by 10–20%, and the lift is even larger on the 3G and spotty 4G networks common in rural tourism regions.
Should tour operators require full payment or accept deposits?
For packages above $300, deposits of 15–25% with the balance due 30 days before arrival typically lift conversion by 15–25%. Deposits reduce buyer friction on high-ticket purchases, improve cash flow predictability, and are standard practice globally—so they rarely feel unusual to international travelers.
What is the best first marketing channel for a new tour operator website?
Google Ads on high-intent, destination-specific keywords (e.g., “private tour Cusco,” “half-day Petra guide”) usually delivers the fastest ROI because the audience is in active booking mode. Travel-category paid search converts at 3–7%, well above the 1.5–2% e-commerce average. Pair it with SEO destination content for compounding long-term returns.
How do I attribute bookings that happen on WhatsApp or by phone?
Use GA4 with offline conversion imports and strict UTM discipline on every outbound link. Tag every WhatsApp click-to-chat URL with campaign parameters, record the booking back to that session via a CRM or spreadsheet, and import conversions into Google Ads and Meta so their smart bidding optimizes for actual revenue rather than form submissions.
References
Statista (2024). Travel & Tourism – Worldwide. https://www.statista.com/outlook/mmo/travel-tourism/worldwide
eMarketer (2024). Global Mobile Commerce Forecast. https://www.emarketer.com/
Google Marketing Platform (2023). Core Web Vitals and Mobile Performance. https://marketingplatform.google.com/
Econsultancy (2023). Travel Industry Digital Benchmarks. https://econsultancy.com/
Shopify (2024). Cross-Border Commerce Report. https://www.shopify.com/enterprise/blog
Klaviyo Blog (2024). E-Commerce Benchmarks Report. https://www.klaviyo.com/blog
HubSpot (2023). State of E-Commerce Conversion. https://www.hubspot.com/
Search Engine Journal (2024). Local Reviews and Consumer Behavior. https://www.searchenginejournal.com/
Content Marketing Institute (2023). UGC and Conversion Impact. https://contentmarketinginstitute.com/
McKinsey Digital (2023). The Future of Travel Consumer Research. https://www.mckinsey.com/industries/travel-logistics-and-infrastructure
Meta for Business (2024). WhatsApp Business Platform Insights. https://www.facebook.com/business
Semrush Blog (2024). Paid Search Benchmarks by Industry. https://www.semrush.com/blog/
Ahrefs Blog (2024). Travel SEO Research. https://ahrefs.com/blog/
Social Media Examiner (2024). Social Media Marketing Industry Report. https://www.socialmediaexaminer.com/
Gartner (2024). Marketing Analytics and Attribution Survey. https://www.gartner.com/en/marketing